|
Arctic sea level from tide gauge stations |
|
02.07.2022 |
|
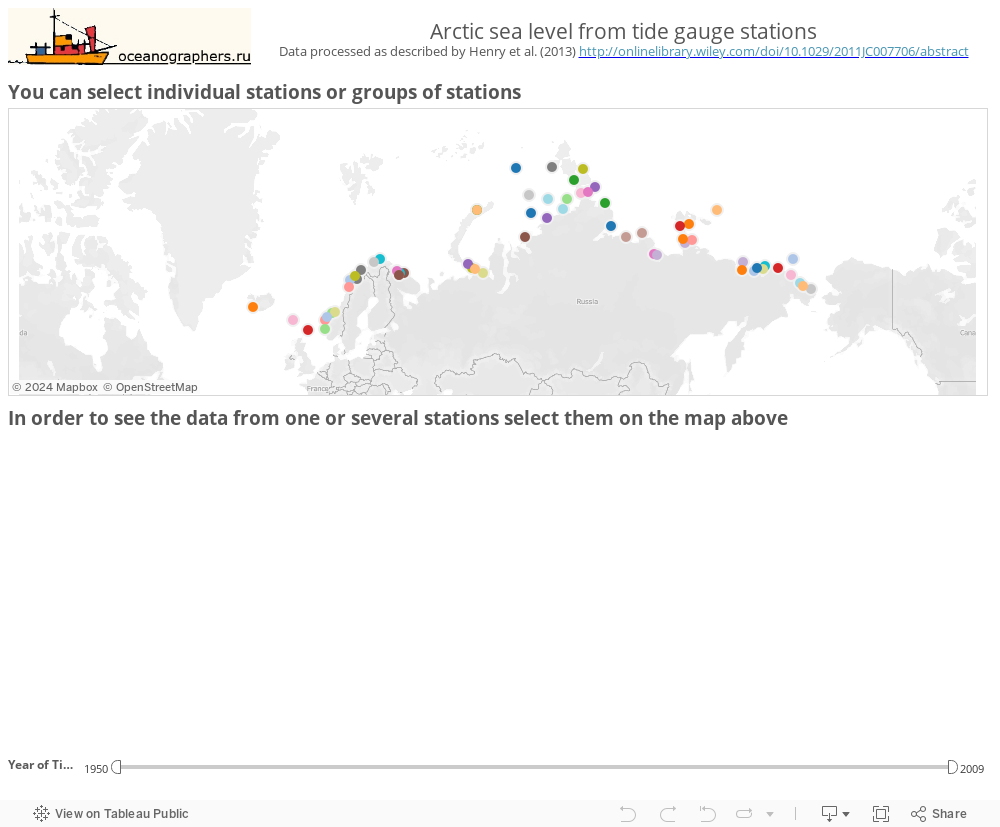
Here is another Tableau visualization that might be useful for some of our visitors. It is sea level from the tide gauge stations in the Northern North Atlantic and Arctic Ocean. Data are processed by Olivier Henry and the processing is described in his paper (
Henry et al., 2012). You can select individual stations or groups of stations. By default only annual mean values are shown. but you can switch to quarterly and monthly means by pressing the cross to the left of the time axis. It is also possible to choose shorter time span by using the slider at the bottom. Have fun :)
|